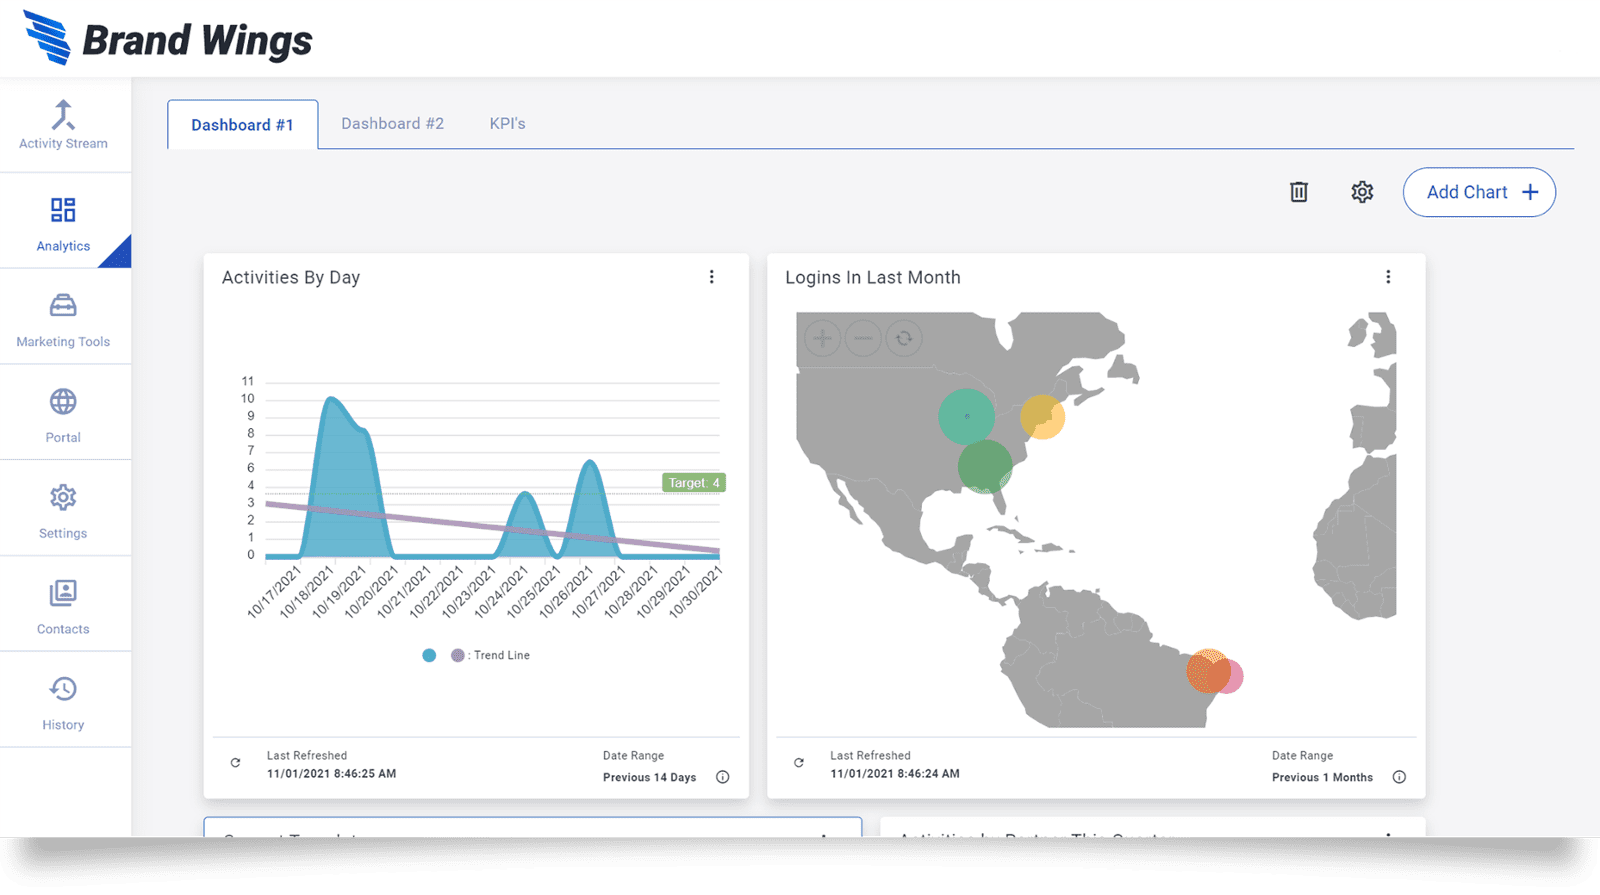
Brand Wings Analytics allows administrators to define an unlimited number of dashboards and assign highly flexible charts to these dashboards. Dashboards can be shared amongst administrative users to reduce duplicated efforts.
Charts can be selected from a variety of categories within the system. Styles and rolling date ranges can be quickly set. Trend lines help your team better understand the true trajectory when peaks and valleys in data appear. Formula-based targets can be displayed on charts to dynamically update goals when underlying data changes. For example, adding new sales staff can be configured to automatically increase goals.
Chart data can be filtered by specific channel partners or by groups of sales teams. Since you define how to categorize sales teams, you can easily generate analytics that matches your business operations and goals.
Brand Wings analytics also support Key Performance Indicators, or KPI’s. You can define RAG (red, amber, green) thresholds using numbers, formulas, or a combination. By building out a variety of KPI charts on a dashboard, you can quickly identify problem areas and more easily manage the overall health of your sales operations.

Ready to take your Management to the next level?


